WebGPU is an upcoming Web API that gives you low-level, general-purpose access GPUs.
I am not very experienced with graphics. I picked up bits and bobs of WebGL by reading through tutorials on how to build game engines with OpenGL and learned more about shaders by watching Inigo Quilez do amazing things on ShaderToy by just using shaders, without any 3D meshes or models. This got me far enough to do build things like the background animation in PROXX, but I was never comfortable with WebGL, and I’ll explain shortly why.
When WebGPU came onto my radar, I wanted to get into it but multiple people warned me that WebGPU has even more boilerplate than WebGL. Undeterred, but anticipating the worst, I scraped together all the tutorials and specifications I could find, of which there are not many because it’s still early days for WebGPU. I got my feet wet and found that I didn’t find WebGPU significantly more boilerplate-y than WebGL, but actually to be an API I am much more comfortable with.
So here we are. I want to share what I learned while wrapping my head around GPUs and WebGPU. The goal for this blog post is to make WebGPU accessible for web developers. But here’s an early heads up: I won’t use WebGPU to generate graphics. Instead, I will use WebGPU to access the raw computing power a GPU provides. Maybe I will do a follow-up blog post how to use WebGPU to render to your screen, but there is already quite a bit of content out there. I will go as deep as necessary to make sense of WebGPU and hopefully enable you to use it effectively — but not necessarily efficiently. I can’t make you a GPU performance expert; mostly because I am not one myself.
Enough disclaimer. This is a long one. Buckle up!
WebGL
WebGL came about in 2011 and, up to this point, was the only low-level API to access GPUs with from the web. WebGL’s API is really just OpenGL ES 2.0 with some thin wrappers and helpers to make it web-compatible. Both WebGL and OpenGL are standardized by the Khronos Group, which is basically the W3C for 3D graphics.
OpenGL’s API itself goes back even further and is, by today’s standard, not a great API. The design is centered around an internal, global state object. The design makes sense from the perspective that it minimizes the amount of data that needs to be transferred to and from the GPU for any given call. However, it also introduces a lot of mental overhead.
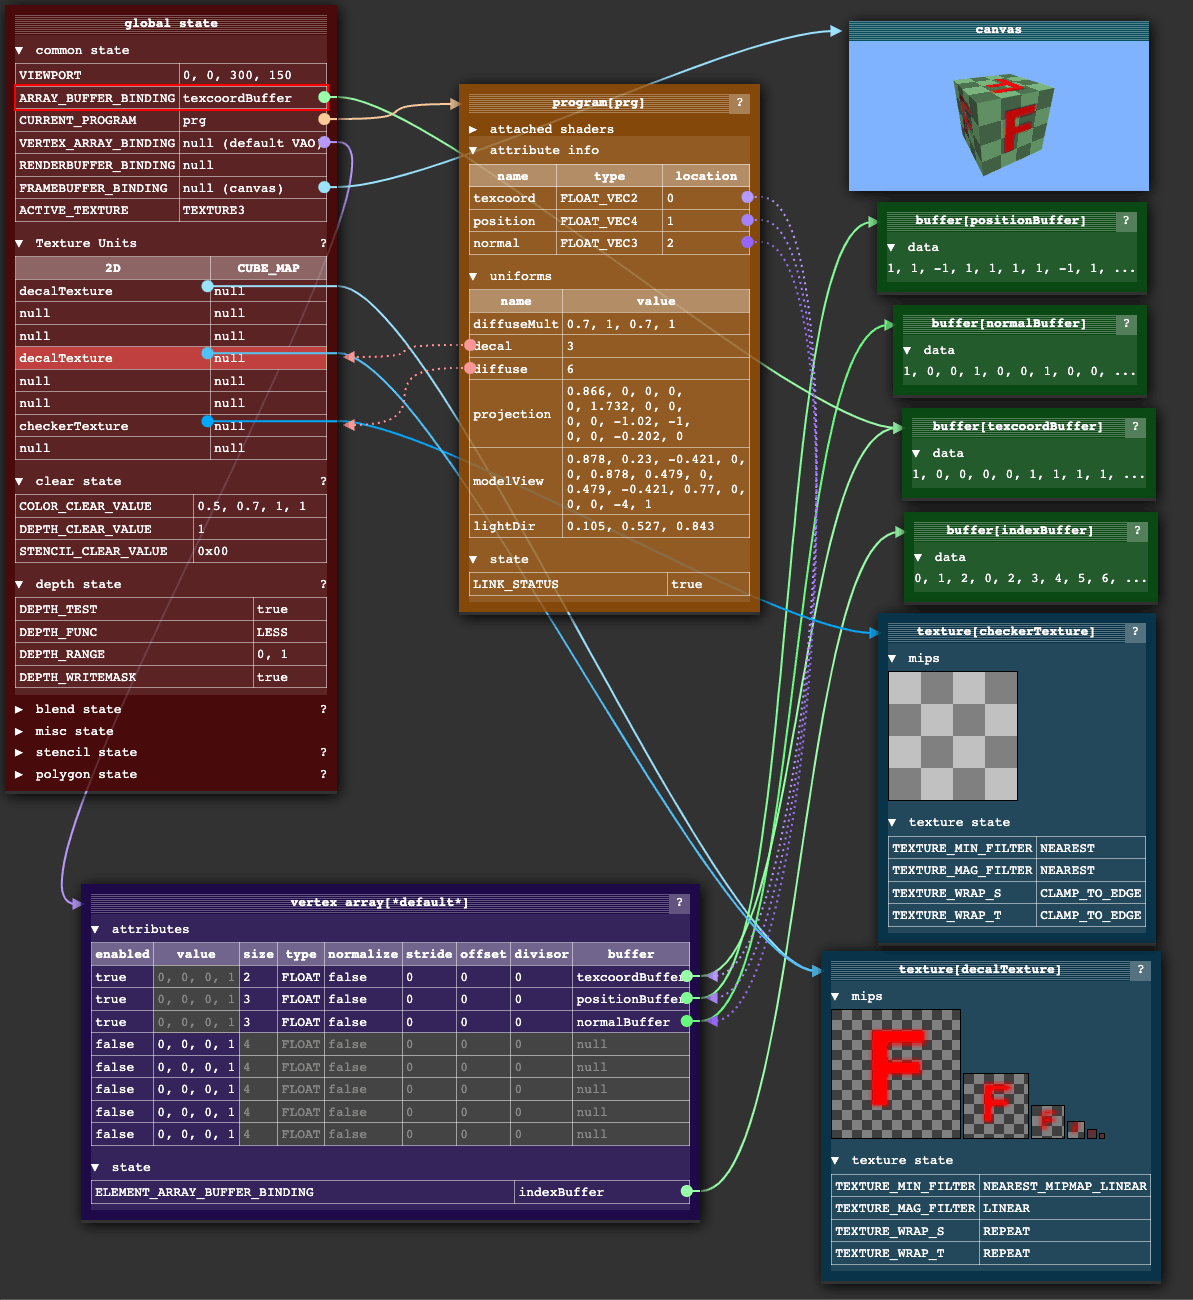
The internal state object is basically a collection of pointers. Your API calls can affect the objects pointed to by the state object, but also the state object itself. As a result, the order of API calls is incredibly important and I always felt like that this makes it hard to build abstractions and libraries. You have to be extremely meticulous in sanitizing all pointers and state items that can interfere the API calls you are going to make, but also restore the pointers and values to their previous value so that your abstractions compose correctly. I often found myself staring at a black canvas (as that’s pretty much all you get in terms of error reporting in WebGL) and brute-forcing which pointer is currently not pointing the right way. Quite honestly, I have no idea how ThreeJS manages to be so robust, but it does manage somehow. I think that’s one of the main reasons why most people use ThreeJS and not WebGL directly.
It’s not you, it’s me: To be clear, me not being able to internalize WebGL is probably a shortcoming of my own. People smarter than me have been able to build amazing stuff with WebGL (and OpenGL outside the web), but it just never really clicked for me.
With the advent of ML, neural networks, and dare I say cryptocurrencies, GPUs have shown that they can be useful for more than just drawing triangles on the screen. Using GPUs for calculations of any kind is often called General-Purpose GPU or GPGPU, and WebGL 1 is not great at this. If you wanted to process arbitrary data on the GPU, you have to encode it as a texture, decode it in a shader, do your calculations and then re-encode the result as a texture. WebGL 2 made this a lot easier with Transform Feedback, but WebGL2 wasn’t supported in Safari until September 2021 (while most other browsers supported WebGL2 since January 2017), so it wasn’t really an option. And even then certain limitations of WebGL2 still made it feel somewhat clunky.
WebGPU
Outside of the web, a new generation of graphics APIs have established themselves which expose a more low-level interface to graphics cards. These new APIs accommodate new use-cases and constraints that weren’t around when OpenGL was designed. On the one hand, GPUs are almost ubiquitous now. Even our mobile devices have capable GPUs built in. As a result, both modern graphics programming (3D rendering and ray tracing) and GPGPU use-cases are increasingly common. On the other hand, most of our devices have multi-core processors, so being able to interact with the GPU from multiple threads can be an important optimization vector. While the WebGPU folks were at it, they also revisited some previous design decisions and front-loaded a lot of the validation work that GPUs have to do, allowing the developer to squeeze more performance out of their GPUs.
The most popular of the next-gen GPU APIs are Vulkan by the Khronos Group, Metal by Apple and DirectX 12 by Microsoft. To bring these new capabilities to the web, WebGPU was born. While WebGL is just a thin wrapper around OpenGL, WebGPU chose a different approach. It introduces its own abstractions and doesn’t directly mirror any of these native APIs. This is partially because no single API is available on all systems, but also because many concepts (such as extremely low-level memory management) aren’t idiomatic for a web-facing API. Instead, WebGPU was designed to both feel “webby” and to comfortably sit on top of any of the native graphics APIs while abstracting their idiosyncrasies. It’s being standardized in the W3C with all major browser vendors having a seat at the table. Due to its comparatively low-level nature and its sheer power, WebGPU has a bit of a learning curve and is relatively heavy on the setup, but I’ll try to break it down as best I can.
Adapters and Devices
WebGPU’s first abstractions that you come into contact with are adapters and (logical) devices.
A physical device is the GPU itself, often distinguished between built-in GPUs and discrete GPUs. Commonly, any given device has exactly one GPU, but it also possible to have two or more GPUs. For example, Microsoft’s SurfaceBook famously has a low-powered integrated GPU and a high-performance discrete GPU between which the operating system will switch on demand.
The driver — provided by the GPU manufacturer — will expose the GPU’s capabilities to the operating system in a way the OS understands and expects. The operating system in turn can expose it to applications, using the graphics APIs the operating system offers, like Vulkan or Metal.
The GPU is a shared resource. It is not only used by many applications at the same time, but also controls what you see on your monitor. There needs to be something that enables multiple processes to use the GPU concurrently, so that each app can put their own UI on screen without interfering with other apps or even maliciously reading other apps’ data. To each process, it looks like they have sole control over the physical GPU, but that is obviously not really the case. This multiplexing is mostly done by the driver and the operating system.
Adapters, in turn, are the translation layer from operating system’s native graphics API to WebGPU. As the browser is a single OS-level application that can run multiple web applications, there is yet again a need for multiplexing, so that each web app feels like it has sole control of the GPU. This is modelled in WebGPU with the concept of logical devices.
To get access to an adapter, you call navigator.gpu.requestAdapter(). At the time of writing, requestAdapter() takes very few options. The options allow you to request a high-performance or low-energy adapter.
Software rendering: Some implementations also offer a “fallback adapter” for systems with no GPU or a GPU that isn’t sufficiently capable. Fallback adapters are effectively a pure software implementation, which will not be very fast but keeps your app functional.
If this succeeds, i.e. the returned adapter is non-null, you can inspect the adapter’s capabilities and request a logical device from the adapter using adapter.requestDevice().
if (!navigator.gpu) throw Error("WebGPU not supported.");

const adapter = await navigator.gpu.requestAdapter();
if (!adapter) throw Error("Couldn’t request WebGPU adapter.");

const device = await adapter.requestDevice();
device.lost.then(()=>{ // this one should not be await-ed.
    throw Error("WebGPU logical device was lost.");
})
Without any options, requestDevice() will return a device that does not necessarily match the physical device’s capabilities, but rather what the WebGPU team considers a reasonable, lowest common denominator of all GPUs. The details are specified in the WebGPU standard. For example, even though my GPU is easily capable of handling data buffers up to 4GiB in size, the device returned will only allow data buffers up to 1GiB, and will reject any data buffers that are bigger. This might seem restrictive, but is actually quite helpful: If your WebGPU app runs with the default device, it will run on the vast majority of devices. If necessary, you can inspect the real limits of the physical GPU via adapter.limits and request a device with raised limits by passing an options object to requestDevice().
For best practices about handling lost devices, check this blog post.
Shaders
If you have ever done any work with WebGL, you are probably familiar with vertex shaders and fragment shaders. Without going too much into depth, the traditional setup works something like this: You upload a data buffer to your GPU and tell it how to interpret that data as a series of triangles. Each vertex occupies a chunk of that data buffer, describing that vertex’ position in 3D space, but probably also auxiliary data like color, texture IDs, normals and other things. Each vertex in the list is processed by the GPU in the vertex stage, running the vertex shader on each vertex, which will apply translation, rotation or perspective distortion.
Shaders: The term “shader” used to confuse me, because you can do so much more than just shading. But in the olden days (i.e. late 1980s!), that term was appropriate: It was a small piece of code that ran on the GPU to decide for each pixel what color it should be so that you could shade the objects being rendered, achieving the illusion of lighting and shadows. Nowadays, shaders loosely refer to any program that runs on the GPU.
The GPU now rasterizes the triangles, meaning the GPU figures out which pixels each triangle covers on the screen. Each pixel is then processed by the fragment shader, which has access to the pixel coordinates but also the auxiliary data to decide which color that pixel should be. When used correctly, amazing 3D graphics can be created with this process.
This system of passing data to a vertex shader, then to a fragment shader and then outputting it directly onto the screen is called a pipeline, and in WebGPU you have to explicitly define your pipeline.
Pipelines
Currently, WebGPU allows you to create two types of pipelines: A Render Pipeline and a Compute Pipeline. As the name suggest, the Render Pipeline renders something, meaning it creates a 2D image. That image needn’t be on screen, but could just be rendered to memory (which is called a Framebuffer). A Compute Pipeline is more generic in that it returns a buffer, which can contain any sort of data. For the remainder of this blog post I’ll focus on Compute Pipelines, as I like to think of Render Pipelines as a specialization/optimization of Compute Pipelines. Now, this is both historically backwards — the compute pipeline was built as a generalization over the very purpose-built rendering pipeline — and also considerably understates that these pipelines are physically different circuits in your GPU. In terms of the API, however, I find this mental model quite helpful. In the future, it seems likely that more types of pipelines — maybe a Raytracing Pipeline — will get added to WebGPU.
With WebGPU, a pipeline consists of one (or more) programmable stages, where each stage is defined by a shader and an entry point. A Compute Pipeline has a single compute stage, while a Render Pipeline would have a vertex and a fragment stage:
const module = device.createShaderModule({
  code: `
    @compute @workgroup_size(64)
    fn main() {
      // Pointless!
    }
  `,
});

const pipeline = device.createComputePipeline({
  compute: {
    module,
    entryPoint: "main",
  },
});
This is the first time WGSL (pronounced “wig-sal”), the WebGPU Shading Language, makes an appearance. WGSL feels like a cross-over of Rust and GLSL to me. It has a lot of Rust-y syntax with GLSL’s global functions (like dot(), norm(), len(), ...), types (like vec2, mat4x4, ...) and the swizzling notation (like some_vec.xxy, ...). The browser will compile your WGSL to whatever the underlying system expects. That’s likely to be HLSL for DirectX 12, MSL for Metal and SPIR-V for Vulkan.
SPIR-V: SPIR-V is interesting because it’s an open, binary, intermediate format standardized by the Khronos Group. You can think of SPIR-V as the LLVM of parallel programming language compilers, and there is support to compile many languages to SPIR-V as well as compiling SPIR-V to many other languages.
In the shader module above we are just creating a function called main and marking it as an entry point for the compute stage by using the @compute attribute. You can have multiple functions marked as an entry point in a shader module, as you can reuse the same shader module for multiple pipelines and choose different functions to invoke via the entryPoint options. But what is that @workgroup_size(64) attribute?
Parallelism
GPUs are optimized for throughput at the cost of latency. To understand this, we have to look a bit at the architecture of GPUs. I don’t want to (and, honestly, can’t) explain it in its entirety. I’ll go as deep as I feel is necessary. If you want to know more, this 13-part blog post series by Fabian Giesen is really good.
Something that is quite well-known is the fact that GPUs have an extensive number of cores that allow for massively parallel work. However, the cores are not as independent as you might be used to from when programming for a multi-core CPU. Firstly, GPU cores are grouped hierarchically. The terminology for the different layers of the hierarchy isn’t consistent across vendors and APIs. Intel has a good piece of documentation that gives a high-level overview of their architecture and I’ve been told it’s safe to assume that other GPUs work at least similarly, despite the exact architecture of GPUs being a NDA-protected secret.
In the case of Intel, the lowest level in the hierarchy is the “Execution Unit” (EU), which has multiple (in this case seven) SIMT cores. That means it has seven cores that operate in lock-step and always execute the same instructions. However, each core has its own set of registers and stack pointer. So while they have to execute the same operation, they can execute it on different data. This is also the reason why GPU performance experts avoid branches (like if/else or loops): If the EU encounters an if/else, all cores have to execute both branches, unless all cores happen to take the same branch. Each core can be told to ignore the instructions it is being fed, but that obviously wastes precious cycles that could be spent computing. The same applies to loops! If one core finishes their loop early, it will have to pretend to execute the loop body until all cores have finished the loop.
Despite the core’s frequency, getting data from memory (or pixels from textures) still takes relatively long — Fabian says it takes a couple hundred clock cycles. These couple hundred cycles could be spent on computation instead. To make use of these otherwise idle cycles, each EU is heavily oversubscribed with work. Whenever an EU would end up idling (e.g. to wait for a value from memory), it instead switches to another work item and will only switch back once the new work item needs to wait for something. This is the key trick how GPUs optimize for throughput at the cost of latency: Individual work items will take longer as a switch to another work item might stop execution for longer than necessary, but the overall utilization is higher and results in a higher throughput. The GPU strives to always have work queued up to keep EUs busy at all times.
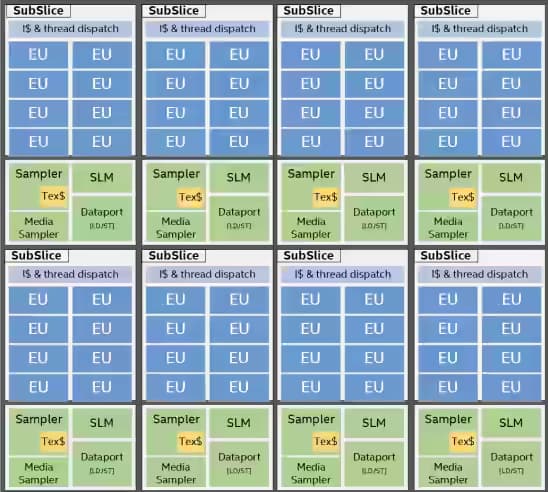
EUs are just the lowest level in the hierarchy, though. Multiple EUs are grouped into what Intel calls a “SubSlice”. All the EUs in a SubSlice have access to a small amount of Shared Local Memory (SLM), which is about 64KiB in Intel’s case. If the program to be run has any synchronization commands, it has to be executed within the same SubSlice, as only they have shared memory for synchronization.
In the last layer multiple SubSlices are grouped into a Slice, which forms the GPU. For an integrated Intel GPU, you end up with a total of 170-700 cores. Discrete GPUs can easily have 1500 and more cores. Again, the naming here is taken from Intel, and other vendors probably use different names, but the general architecture is similar in every GPU.
To fully exploit the benefits of this architecture, programs need to be specifically set up for this architecture so that a purely programmatic GPU scheduler can maximize utilization. As a result, graphics APIs expose a threading model that naturally allows for work to be dissected this way. In WebGPU, the important primitive here is the “workgroup”.
Workgroups
In the traditional setting, the vertex shader would get invoked once for each vertex, and the fragment shader once for each pixel (I’m glossing over some details here, I know). In the GPGPU setting, your compute shader will be invoked once for each work item that you schedule. It is up to you to define what a work item is.
The collection of all work items (which I will call the “workload”) is broken down into workgroups. All work items in a workgroup are scheduled to run together. In WebGPU, the work load is modelled as a 3-dimensional grid, where each “cube” is a work item, and work items are grouped into bigger cuboids to form a workgroup.
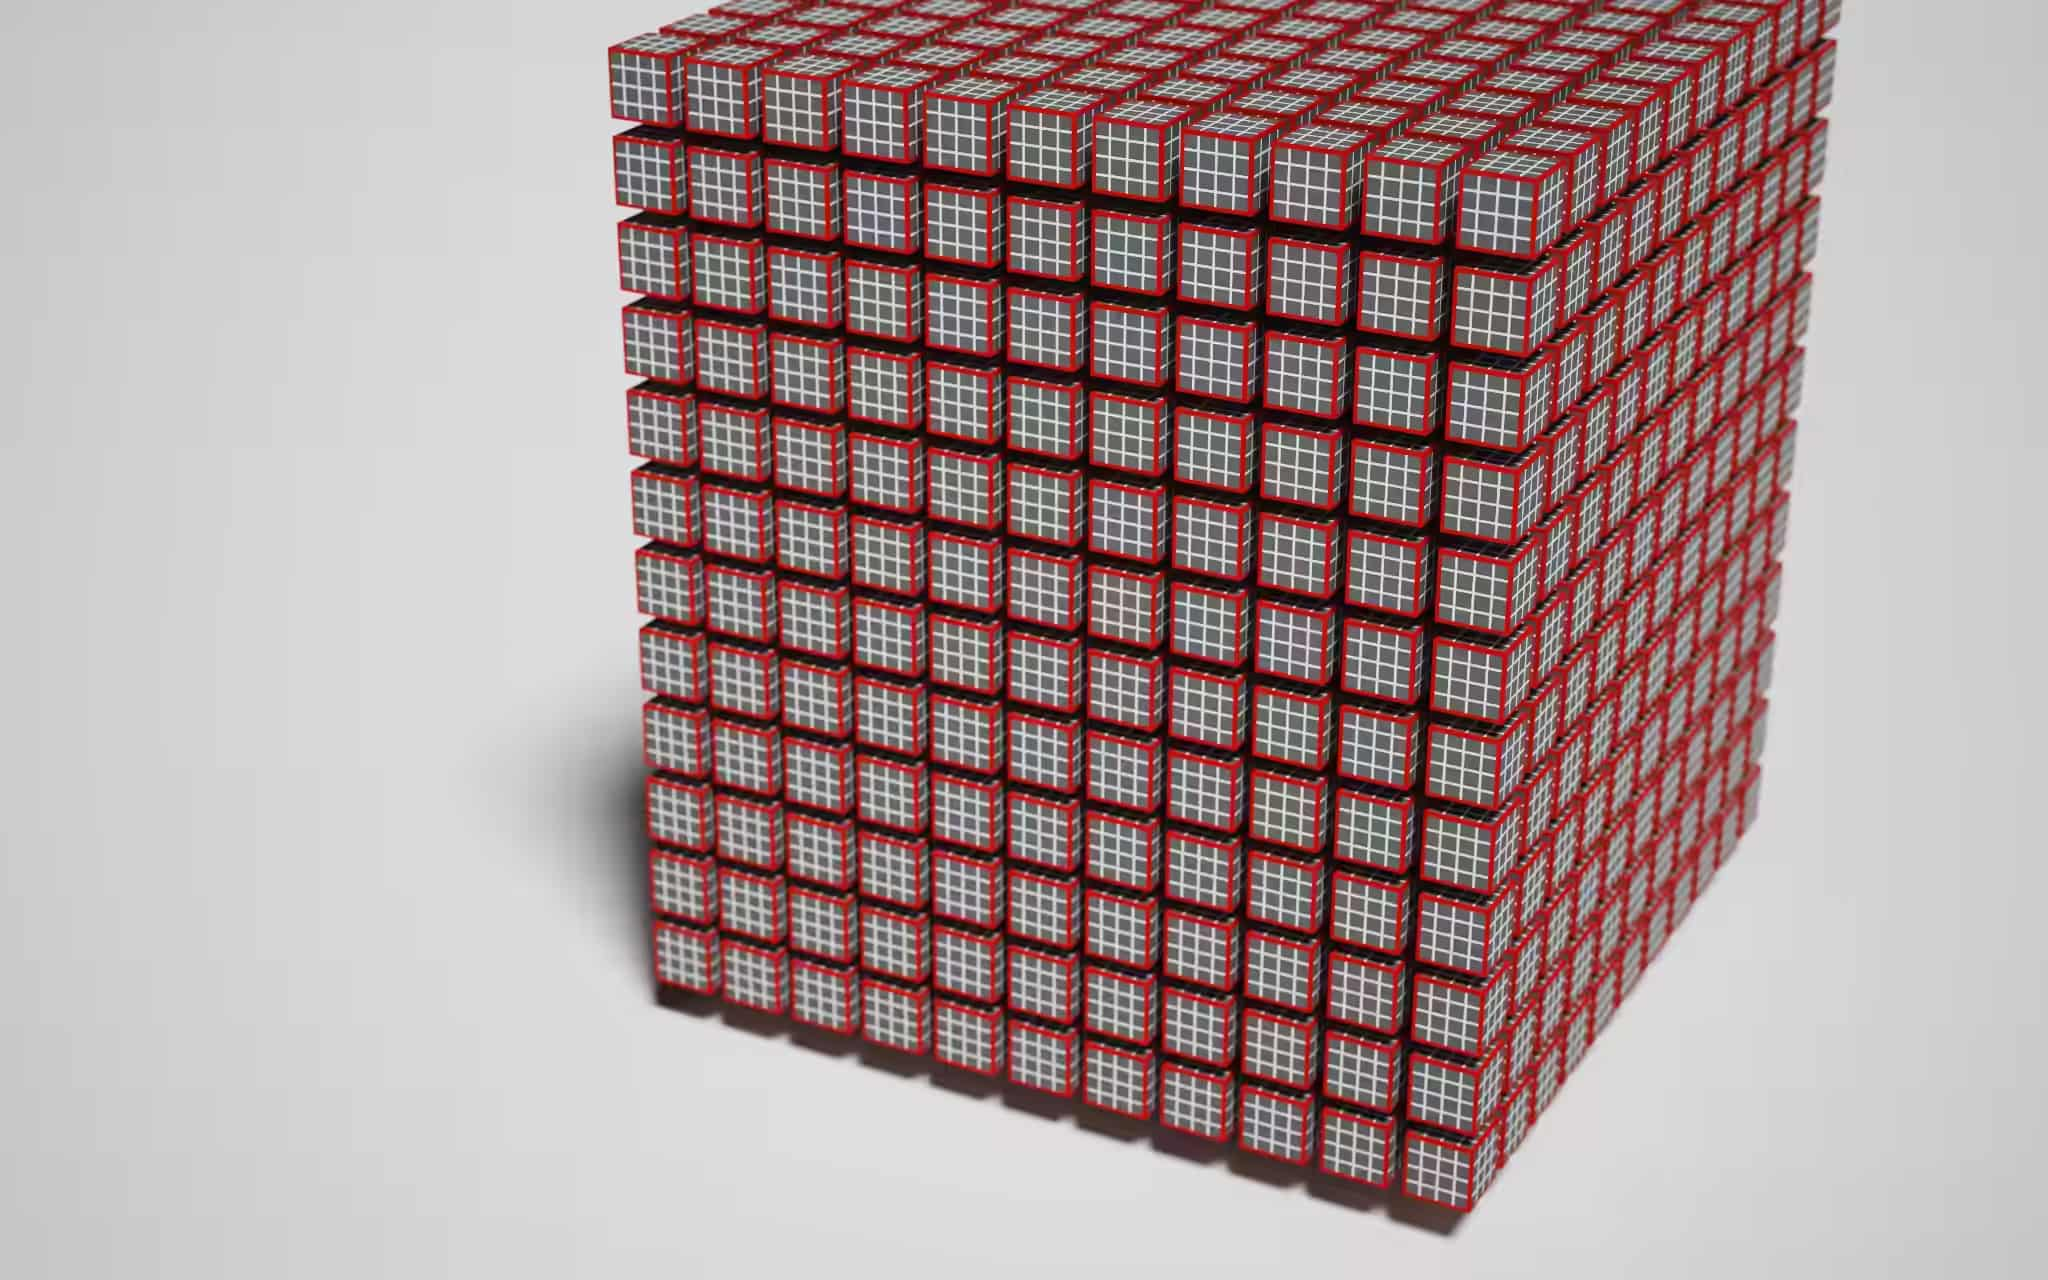
Finally, we have enough information to talk about the @workgroup_size(x, y, z) attribute, and it might even be mostly self-explanatory at this point: The attribute allows you to tell the GPU what the size of a workgroup for this shader should be. Or in the language of the picture above, the @workgroup_size attribute defines the size of the red-bordered cubes. is the number of work items per workgroup. Any skipped parameter is assumed to be 1, so @workgroup_size(64) is equivalent to @workgroup_size(64, 1, 1).
Of course, the actual EUs are not arranged in the 3D grid on the chip. The aim of modelling work items in a 3D grid is to increase locality. The assumption is that it is likely that neighboring work groups will access similar areas in memory, so when running neighboring workgroups sequentially, the chances of already having values in the cache are higher, saving a couple of hundred cycles by not having to grab them from memory. However, most hardware seemingly just runs workgroups in a serial order as the difference between running a shader with @workgroup_size(64) or @workgroup_size(8, 8) is negligible. So this concept is considered somewhat legacy.
However, workgroups are restricted in multiple ways: device.limits has a bunch of properties that are worth knowing:
// device.limits
{
  // ...
  maxComputeInvocationsPerWorkgroup: 256,
  maxComputeWorkgroupSizeX: 256,
  maxComputeWorkgroupSizeY: 256,
  maxComputeWorkgroupSizeZ: 64,
  maxComputeWorkgroupsPerDimension: 65535,
  // ...
}
The size of each dimension of a workgroup size is restricted, but even if x, y and z individually are within the limits, their product () might not be, as it has a limit of its own. Lastly, you can only have so many workgroups per dimension.
Pro tip: Don’t spawn the maximum number of threads. Despite the GPU being managed by the OS and an underlying scheduler, you may freeze your entire system with a long-running GPU program.
So what is the right workgroup size? It really depends on the semantics you assign the work item coordinates. I do realize that this is not really an helpful answer, so I want to give you the same advice that Corentin gave me: “Use [a workgroup size of] 64 unless you know what GPU you are targeting or that your workload needs something different.” It seems to be a safe number that performs well across many GPUs and allows the GPU scheduler to keep as many EUs as possible busy.
Commands
We have written our shader and set up the pipeline. All that’s left to do is actually invoke the GPU to execute it all. As a GPU can be a completely separate card with it’s own memory chip, you control it via a so-called command buffer or command queue. The command queue is a chunk of memory that contains encoded commands for the GPU to execute. The encoding is highly specific to the GPU and is taken care of by the driver. WebGPU exposes a CommandEncoder to tap into that functionality.
const commandEncoder = device.createCommandEncoder();
const passEncoder = commandEncoder.beginComputePass();
passEncoder.setPipeline(pipeline);
passEncoder.dispatchWorkgroups(1);
passEncoder.end();
const commands = commandEncoder.finish();
device.queue.submit([commands]);
commandEncoder has multiple methods that allows you to copy data from one GPU buffer to another and manipulate textures. It also allows you to create PassEncoder, which encodes the setup and invocation of pipelines. In this case, we have a compute pipeline, so we have to create a compute pass, set it to use our pre-declared pipeline and finally call dispatchWorkgroups(w_x, w_y, w_z) to tell the GPU how many workgroups to create along each dimension. In other words, the number of times our compute shader will be invoked is equal to . The pass encoder, by the way, is WebGPU’s abstraction to avoid that internal, global state object I was ranting about at the start of this blog post. All data and state required to run a GPU pipeline is explicitly passed along through the pass encoder.
Abstraction: The command buffer is also the hook for the driver or operating system to let multiple applications use the GPU without them interfering with each other. When you queue up your commands, the abstraction layers below will inject additional commands into the queue to save the previous program’s state and restore your program’s state so that it feels like no one else is using the GPU.
Running this code, we are in fact spawning 64 threads on the GPU and they do absolutely nothing. But it works, so that’s cool. Let’s talk about how we give the GPU some data to work.
Exchanging data
As promised, I won’t be using WebGPU for graphics directly, so instead I thought it’d be fun to run a physics simulation on the GPU and visualize it using Canvas2D. Maybe I am flattering myself calling it a “physics simulation” — what I am doing is generating a whole bunch of circles, have them roll around on a plane in random directions and letting them collide.
For this to work, we need to push some simulation parameters and the initial state to the GPU, run the simulation on the GPU and read the simulation results from the GPU. This is arguably the hairiest part of WebGPU, as there’s a bunch of data acrobatics (not to say seemingly pointless copying), but this is what allows WebGPU to be a device-agnostic API running at the highest level of performance.
Bind Group Layouts
To exchange data with the GPU, we need to extend our pipeline definition with a bind group layout. A bind group is a collection of GPU entities (memory buffers, textures, samplers, etc) that are made accessible during the execution of the pipeline. The bind group layout pre-defines the types, purposes and uses of these GPU entities, which allows the GPU figure out how to run a pipeline most efficiently ahead of time. Let’s keep it simple in this initial step and give our pipeline access to a single memory buffer:
const bindGroupLayout =
 device.createBindGroupLayout({
    entries: [{
      binding: 1,
      visibility: GPUShaderStage.COMPUTE,
      buffer: {
        type: "storage",
      },
    }],
  });

const pipeline = device.createComputePipeline({
  layout: device.createPipelineLayout({
    bindGroupLayouts: [bindGroupLayout],
  }),
  compute: {
    module,
    entryPoint: "main",
  },
});
The binding number can be freely chosen and is used to tie a variable in our WGSL code to the contents of the buffer in this slot of the bind group layout. Our bindGroupLayout also defines the purpose for each buffer, which in this case is "storage". Another option is "read-only-storage", which is read-only (duh!), and allows the GPU to make further optimizations on the basis that this buffer will never be written to and as such doesn’t need to be synchronized. The last possible value for the buffer type is "uniform", which in the context of a compute pipeline is mostly functionally equivalent to a storage buffer.
The bind group layout is in place. Now we can create the bind group itself, containing the actual instances of the GPU entities the bind group layout expects. Once that bind group with the buffer inside is in place, the compute shader can fill it with data and we can read it from the GPU. But there’s a hurdle: Staging Buffers.
Staging Buffers
I will say it again: GPUs are heavily optimized for throughput at the cost of latency. A GPU needs to be able feed data to the cores at an incredibly high rate to sustain that throughput. Fabian did some back-of-napkin math in his blog post series from 2011, and arrived at the conclusion that GPUs need to sustain 3.3GB/s just for texture samples for a shader running at 1280x720 resolution. To accommodate today’s graphics demands, GPUs need shovel data even faster. This is only possible to achieve if the memory of the GPU is very tightly integrated with the cores. This tight integration makes it hard to also expose the same memory to the host machine for reading and writing.
Instead, GPUs have additional memory banks that are accessible to both the host machine as well as the GPU, but are not as tightly integrated and can’t provide data as fast. Staging buffers are buffers that are allocated in this intermediate memory realm and can be mapped to the host system for reading and writing. To read data from the GPU, we copy data from an internal, high-performance buffer to a staging buffer, and then map the staging buffer to the host machine so we can read the data back into main memory. For writing, the process is the same but in reverse.
Back to our code: We will create a writable buffer and add it to the bind group, so that it can be written to by the compute shader. We will also create a second buffer with the same size that will act as a staging buffer. Each buffer is created with a usage bitmask, where you can declare how you intend to use that buffer. The GPU will then figure out where the buffer should be located to fulfill all these use-cases or throw an error if the combination of flags is unfulfillable.
const BUFFER_SIZE = 1000;

const output = device.createBuffer({
  size: BUFFER_SIZE,
  usage: GPUBufferUsage.STORAGE | GPUBufferUsage.COPY_SRC
});

const stagingBuffer = device.createBuffer({
  size: BUFFER_SIZE,
  usage: GPUBufferUsage.MAP_READ | GPUBufferUsage.COPY_DST,
});

const bindGroup = device.createBindGroup({
  layout: bindGroupLayout,
  entries: [{
    binding: 1,
    resource: {
      buffer: output,
    },
  }],
});
Note that createBuffer() returns a GPUBuffer, not an ArrayBuffer. They can’t be read or written to just yet. For that, they need to be mapped, which is a separate API call and will only succeed for buffers that have GPUBufferUsage.MAP_READ or GPUBufferUsage.MAP_WRITE.
TypeScript: I found TypeScript to be quite helpful when exploring new APIs. Luckily, Chrome’s WebGPU team maintains
@webgpu/typesso you can enjoy accurate auto-completion.
Now that we not only have the bind group layout, but even the actual bind group itself, we need to update our dispatch code to make use of this bind group. Afterwards we map our staging buffer to read the results back into JavaScript.
const commandEncoder = device.createCommandEncoder();
const passEncoder = commandEncoder.beginComputePass();
passEncoder.setPipeline(pipeline);
passEncoder.setBindGroup(0, bindGroup);
passEncoder.dispatchWorkgroups(1);
passEncoder.dispatchWorkgroups(Math.ceil(BUFFER_SIZE / 64));
passEncoder.end();
commandEncoder.copyBufferToBuffer(
  output,
  0, // Source offset
  stagingBuffer,
  0, // Destination offset
  BUFFER_SIZE
);
const commands = commandEncoder.finish();
device.queue.submit([commands]);

await stagingBuffer.mapAsync(
  GPUMapMode.READ,
  0, // Offset
  BUFFER_SIZE // Length
 );
const copyArrayBuffer =
  stagingBuffer.getMappedRange(0, BUFFER_SIZE);
const data = copyArrayBuffer.slice();
stagingBuffer.unmap();
console.log(new Float32Array(data));
Since we added a bind group layout to our pipeline, any invocation without providing a bind group would now fail. After we define our “pass”, we add an additional command via our command encoder to copy the data from our output buffer to the staging buffer and submit our command buffer to the queue. The GPU will start working through the command queue. We don’t know when the GPU will be done exactly, but we can already submit our request for the stagingBuffer to be mapped. This function is async as it needs to wait until the command queue has been fully processed. When the returned promise resolves, the buffer is mapped, but not exposed to JavaScript yet. stagingBuffer.getMappedRange() let’s us request for a subsection (or the entire buffer) to be exposed to JavaScript as a good ol’ ArrayBuffer. This is real, mapped GPU memory, meaning the data will disappear (the ArrayBuffer will be “detached”), when stagingBuffer gets unmapped, so I’m using slice() to create JavaScript-owned copy.
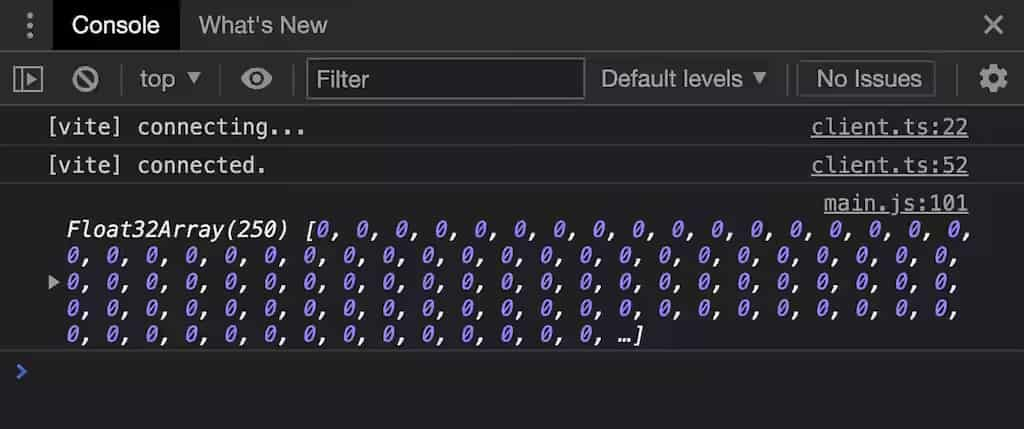
Something other than zeroes would probably be a bit more convincing. Before we start doing any advanced calculation on our GPU, let’s put some hand-picked data into our buffer as proof that our pipeline is indeed working as intended. This is our new compute shader code, with extra spacing for clarity.
@group(0) @binding(1)
var<storage, read_write> output: array<f32>;

@compute @workgroup_size(64)
fn main(

  @builtin(global_invocation_id)
  global_id : vec3<u32>,

  @builtin(local_invocation_id)
  local_id : vec3<u32>,

) {
  output[global_id.x] =
    f32(global_id.x) * 1000. + f32(local_id.x);
}
The first two lines declare a module-scope variable called output, which is a dynamically-sized array of f32. The attributes declare where the data comes from: From the buffer in our first (0th) binding group, the entry with binding value 1. The length of the array will automatically reflect the length of the underlying buffer (rounded down).
Variables: WGSL diverges from Rust in that a variable declared with
letis immutable. If you want a variable to be mutable, they keyword to use isvar.
The signature of our main() function has been augmented with two parameters: global_id and local_id. I could have chosen any name — their value is determined by the attributes associated with them: The global_invocation_id is a built-in value that corresponds to the global x/y/z coordinates of this shader invocation in the work load. The local_invocation_id is the x/y/z coordinates of this shader vocation in the work group.
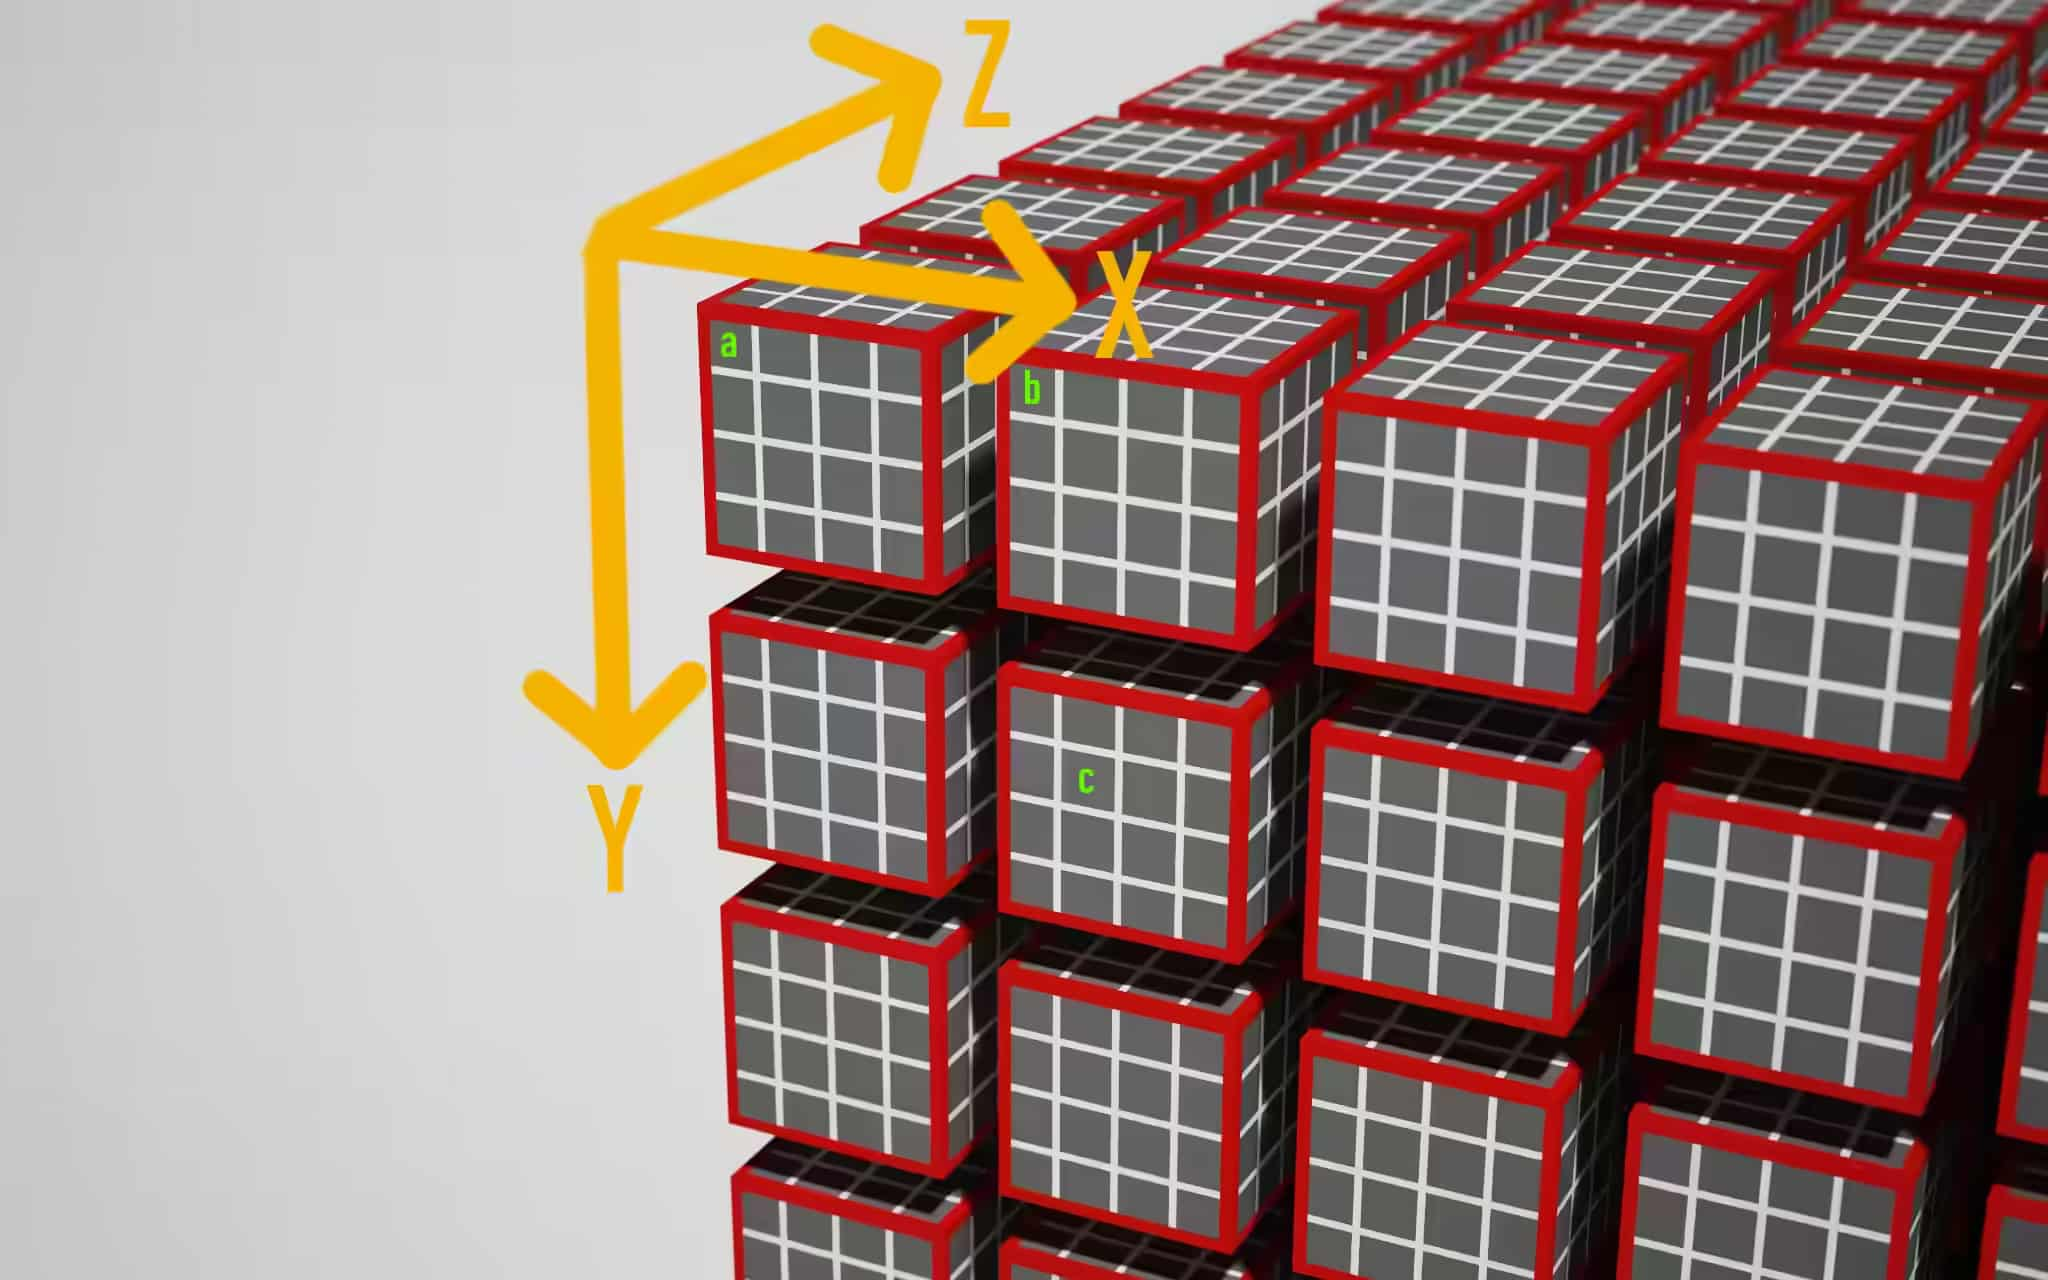
This image shows one possible interpretation of the coordinate system for a workload with @workgroup_size(4, 4, 4). It is up to you to define what the coordinate system is for your use-case. If we agreed on the axes as drawn above, we’d see the following main() parameters for a, b and c:
- a:
local_id=(x=0, y=0, z=0)global_id=(x=0, y=0, z=0)
- b:
local_id=(x=0, y=0, z=0)global_id=(x=4, y=0, z=0)
- c:
local_id=(x=1, y=1, z=0)global_id=(x=5, y=5, z=0)
In our shader, we have @workgroup_size(64, 1, 1), so local_id.x will range from 0 to 63. To be able to inspect both values, I am “encoding” them into a single number. Note that WGSL is strictly typed: Both local_id and global_id are vec3<u32>, so we have to explicitly cast their values to f32 to be able to assign them to our f32 output buffer.
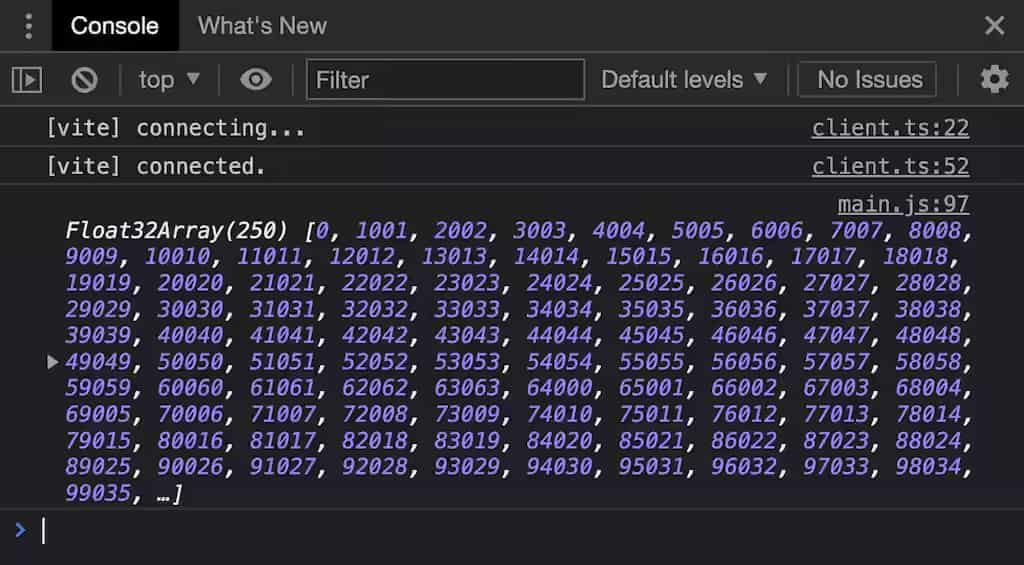
And this proves that our compute shader is indeed invoked for each value in the output memory and fills it with a unique value. We won’t know in which order this data has been filled in, as that’s intentionally unspecified and left up to the GPU’s scheduler.
Overdispatching
The astute observer might have noticed that the total number of shader invocations (Math.ceil(BUFFER_SIZE / 64) * 64) will result in global_id.x getting bigger than the length of our array, as each f32 takes up 4 bytes. Luckily, accessing an array is safe-guarded by an implicit clamp, so every write past the end of the array will end up writing to the last element of the array. That avoids memory access faults, but might still generate unusable data. And indeed, if you check the last 3 elements of the returned buffer, you’ll find the numbers 247055, 248056 and 608032. It’s up to us to prevent that from happening in our shader code with an early exit:
fn main( /* ... */) {
  if(global_id.x >= arrayLength(&output)) {
    return;
  }
  output[global_id.x] =
    f32(global_id.x) * 100. + f32(local_id.x);
}
If you want, you can run this demo and inspect the full source. Note: the extra additions do not seem happen anymore. But we keep them to stop extra executions. See this issue.
A structure for the madness
Our goal here is to have a whole lotta balls moving through 2D space and have happy little collisions. For that, each ball needs to have a radius, a position and a velocity vector. We could just continue working on array<f32>, and say the first float is the first ball’s x position, the second float is the first ball’s y position and so on, and so forth. That’s not what I would call ergonomic. Luckily, WGSL allows us to define our own structs to tie multiple pieces of data together in a neat bag.
Old news: If you know what memory alignment is, you can skip this section (although do take a look at the code sample). If you don’t know what it is, I won’t really explain the why, but show you how it manifests and how to work with it.
So it makes sense to define a struct Ball with all these components and turn our array<f32> into array<Ball>. The downside of all this: we have to talk about alignment.
struct Ball {
  radius: f32,
  position: vec2<f32>,
  velocity: vec2<f32>,
}

@group(0) @binding(1)
var<storage, read_write> output: array<f32>;
var<storage, read_write> output: array<Ball>;

@compute @workgroup_size(64)
fn main(
  @builtin(global_invocation_id) global_id : vec3<u32>,
  @builtin(local_invocation_id) local_id : vec3<u32>,
) {
  let num_balls = arrayLength(&output);
  if(global_id.x >= num_balls) {
    return;
  }

  output[global_id.x].radius = 999.;
  output[global_id.x].position = vec2<f32>(global_id.xy);
  output[global_id.x].velocity = vec2<f32>(local_id.xy);
}
If you run this demo, you’ll see this in your console:
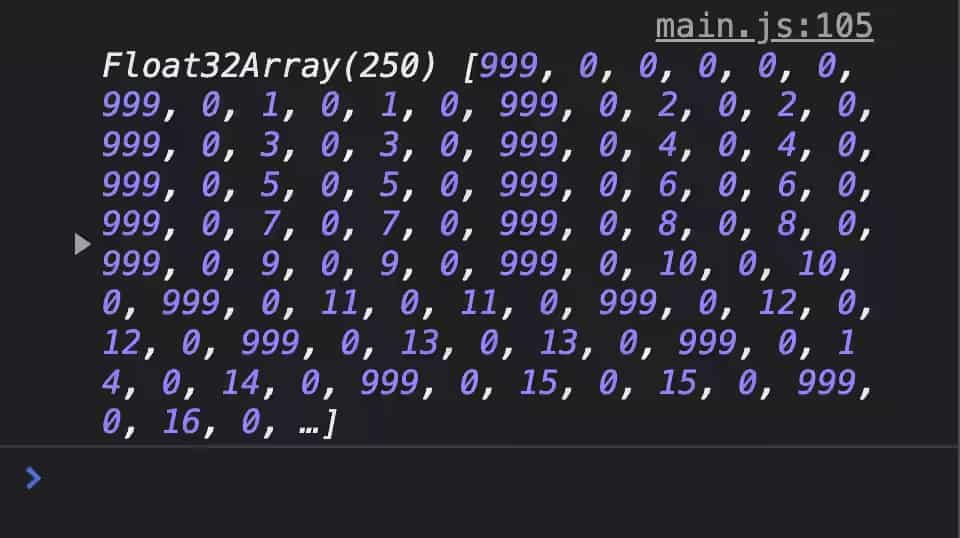
I put 999 the first field of the struct to make it easy to see where the struct begins in the buffer. There’s a total of 6 numbers until we reach the next 999, which is a bit surprising because the struct really only has 5 numbers to store: radius, position.x, position.y, velocity.x and velocity.y. Taking a closer look, it is clear that the number after radius is always 0. This is because of alignment.
Each WGSL data type has well-defined alignment requirements. If a data type has an alignment of , it means that a value of that data type can only be stored at a memory address that is a multiple of . f32 has an alignment of 4, while vec2<f32> has an alignment of 8. If we assume our struct starts at address 0, then the radius field can be stored at address 0, as 0 is a multiple of 4. The next field in the struct is vec2<f32>, which has an alignment of 8. However, the first free address after radius is 4, which is not a multiple of 8. To remedy this, the compiler adds padding of 4 bytes to get to the next address that is a multiple of 8. This explains why we see an unused field with the value 0 in the DevTools console.
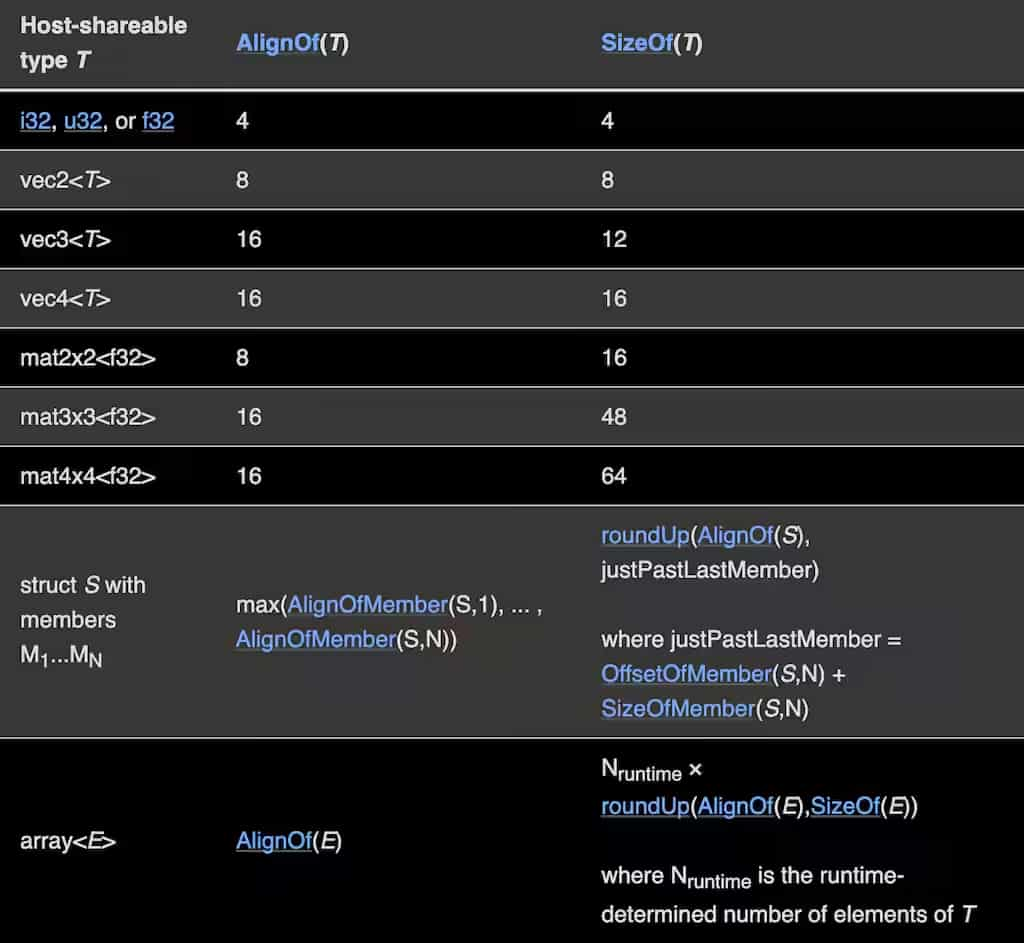
The (shortened) alignment table from the WGSL spec.
Now that we know how our struct is laid out in memory, we can populate it from JavaScript to generate our initial state of balls and also read it back to visualize it.
Input & Output
We have successfully managed to read data from the GPU, bring it to JavaScript and “decode” it. It’s now time to tackle the other direction. We need to generate the initial state of all our balls in JavaScript and give it to the GPU so it can run the compute shader on it. Generating the initial state is fairly straight forward:
let inputBalls = new Float32Array(new ArrayBuffer(BUFFER_SIZE));
for (let i = 0; i < NUM_BALLS*6; i+=6) {
  inputBalls[i + 0] = randomBetween(2, 10); // radius
  inputBalls[i + 1] = 0; // padding
  inputBalls[i + 2] = randomBetween(0, ctx.canvas.width); // position.x
  inputBalls[i + 3] = randomBetween(0, ctx.canvas.height); // position.y
  inputBalls[i + 4] = randomBetween(-100, 100); // velocity.x
  inputBalls[i + 5] = randomBetween(-100, 100); // velocity.y
}
Buffer-backed-object: With more complex data structures, it can get quite tedious to manipulate the data from JavaScript. While originally written for worker use-cases, my library
buffer-backed-objectcan come in handy here!
We also already know how to expose a buffer to our shader. We just need to adjust our pipeline bind group layout to expect another buffer:
const bindGroupLayout = device.createBindGroupLayout({
  entries: [
    {
      binding: 0,
      visibility: GPUShaderStage.COMPUTE,
      buffer: {
        type: "read-only-storage",
      },
    },
    {
      binding: 1,
      visibility: GPUShaderStage.COMPUTE,
      buffer: {
        type: "storage",
      },
    },
  ],
});
... and create a GPU buffer that we can bind using our bind group:
const input = device.createBuffer({
  size: BUFFER_SIZE,
  usage: GPUBufferUsage.STORAGE | GPUBufferUsage.COPY_DST,
});

const bindGroup = device.createBindGroup({
  layout: bindGroupLayout,
  entries: [
    {
      binding: 0,
      resource: {
        buffer: input,
      },
    },
    {
      binding: 1,
      resource: {
        buffer: output,
      },
    },
  ],
});
Now for the new part: Sending data to the GPU. Just like with reading data, we technically have to create a staging buffer that we can map, copy our data into the staging buffer and then issue a command to copy our data from the staging buffer into the storage buffer. However, WebGPU offers a convenience function that will choose the most efficient way of getting our data into the storage buffer for us, even if that involves creating a temporary staging buffer on the fly:
device.queue.writeBuffer(input, 0, inputBalls);
That’s it? That’s it! We don’t even need a command encoder. We can just put this command directly into the command queue. device.queue offers some other, similar convenience functions for textures as well.
Now we need to bind this new buffer to a variable in WGSL and do something with it:
struct Ball {
  radius: f32,
  position: vec2<f32>,
  velocity: vec2<f32>,
}

@group(0) @binding(0)
var<storage, read> input: array<Ball>;

@group(0) @binding(1)
var<storage, read_write> output: array<Ball>;

const TIME_STEP: f32 = 0.016;

@compute @workgroup_size(64)
fn main(
  @builtin(global_invocation_id)
  global_id : vec3<u32>,
) {
  let num_balls = arrayLength(&output);
  if(global_id.x >= num_balls) {
    return;
  }
  output[global_id.x].position =
    input[global_id.x].position +
    input[global_id.x].velocity * TIME_STEP;
}
I hope that the vast majority of this shader code contains no surprises for you at this point.
Lastly, all we need to do is read the output buffer back into JavaScript, write some Canvas2D code to visualize the contents of the buffer and put it all in a requestAnimationFrame() loop. You can see the result this demo.
Performance
The previous demo just moves each ball along their velocity vector. Not exactly thrilling or computationally complex. Before we look at the performance characteristics of our creation, let me drop in some proper physics calculations in the shader. I won’t explain them here — the blog post is long enough as it is — but I will say that I took the maximally naïve approach: every ball checks for collisions with every other ball. If you are curious, you can take a look at the source code of the final demo, which also contains links to the resources I used to write the physics-y bits.
I don’t want to take any exact measurements of this experiment as I haven’t optimized the physics algorithm nor my usage of WebGPU. However, the fact that even this naïve implementation performs really well (on my M1 MacBook Air) is impressive to me. I can go to around 2500 balls before we drop below 60fps. However, looking at the trace, it’s clear that at 2500 balls the bottleneck is Canvas2D trying to draw the scene, not the WebGPU calculations.
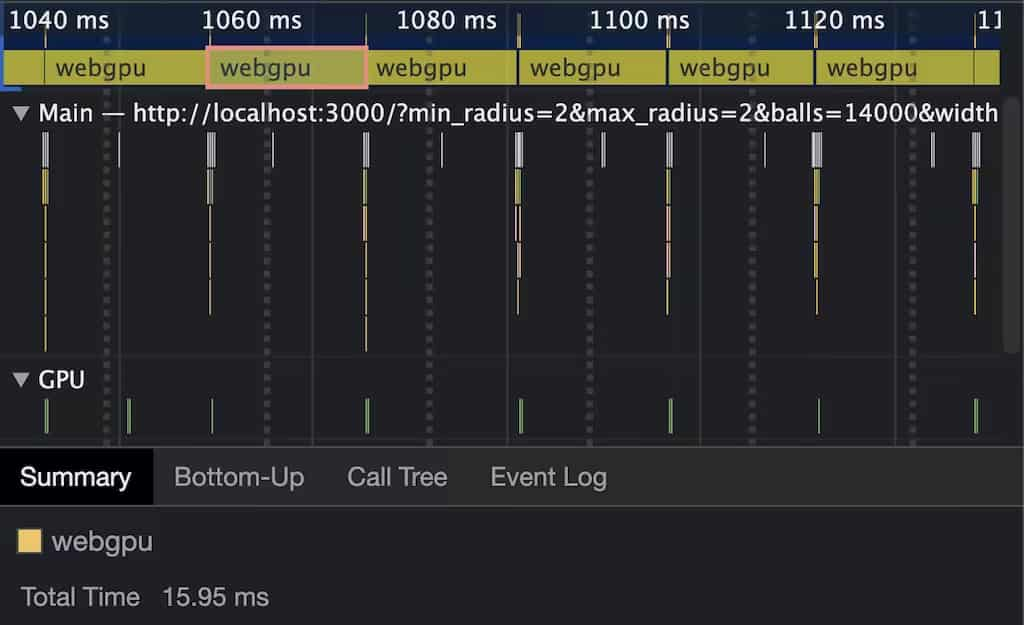
To see how fast this really is, I disabled rendering and instead used performance.measure() to see how many balls I can simulate before exhausting my frame budget of 16ms. This happens at around 14000 balls on my machine. Something this unoptimized running this fast really makes me drunk on power with how much computational power WebGPU gives me access to.
Stability & Availability
WebGPU has been worked on for a while and I think the standards group is eager to declare the API as stable. That being said, the API is only available in Chrome and Firefox behind a flag. I’m optimistic about Safari shipping this API but at the time of writing there’s nothing to see in Safari TP just yet.
In terms of stability, some changes landed even while I was doing the research for this article. For example, the syntax for attributes was changed from [[stage(compute), workgroup_size(64)]] to @compute @workgroup_size(64). At the time of writing, Firefox is still on the old syntax. passEncoder.end() used to be passEncoder.endPass(). There are also some things in the spec that haven’t been implemented in any browser yet like shader constants or the API being available on mobile devices.
Basically what I am saying is: Expect some more breaking changes to happen while the browsers and standards folks are on the home stretch of this API’s journey to ✨stable✨.
Conclusion
Having a modern API to talk to GPUs on the web is going to be very interesting. After investing time to overcome the initial learning curve, I really feel empowered to run massively parallel workloads on the GPU using JavaScript. There is also wgpu, which implements the WebGPU API in Rust, allowing you to use the API outside the browser. wgpu also support WebAssembly as a compile target, so you could run your WebGPU program natively outside the browser and inside the browser via WebAssembly. Fun fact: Deno is the first runtime also support WebGPU out of the box (thanks to wgpu).
If you have questions or are running into problems, there is a Matrix channel with many WebGPU users, browser engineers and standards folks that have been incredibly helpful to me. Go get your feet wet! Exciting times.
Thanks to Brandon Jones for proof-reading this article and the WebGPU Matrix channel for answering all my questions.